Ionization Energy Chart: Unlock the Secrets (Explained!)
The ionization energy chart serves as a fundamental tool, visualizing periodic trends predicted by quantum mechanics. This chart enables chemists to understand and predict the reactivity of elements, a vital skill within materials science. Linus Pauling, renowned for his work on electronegativity, also contributed significantly to our understanding of the concepts underpinning ionization energy chart. Furthermore, data from modern spectroscopy techniques, often interpreted with the aid of an ionization energy chart, allows researchers to probe the electronic structure of matter at the atomic level, enabling deeper insights and more predictable designs for innovative new materials.
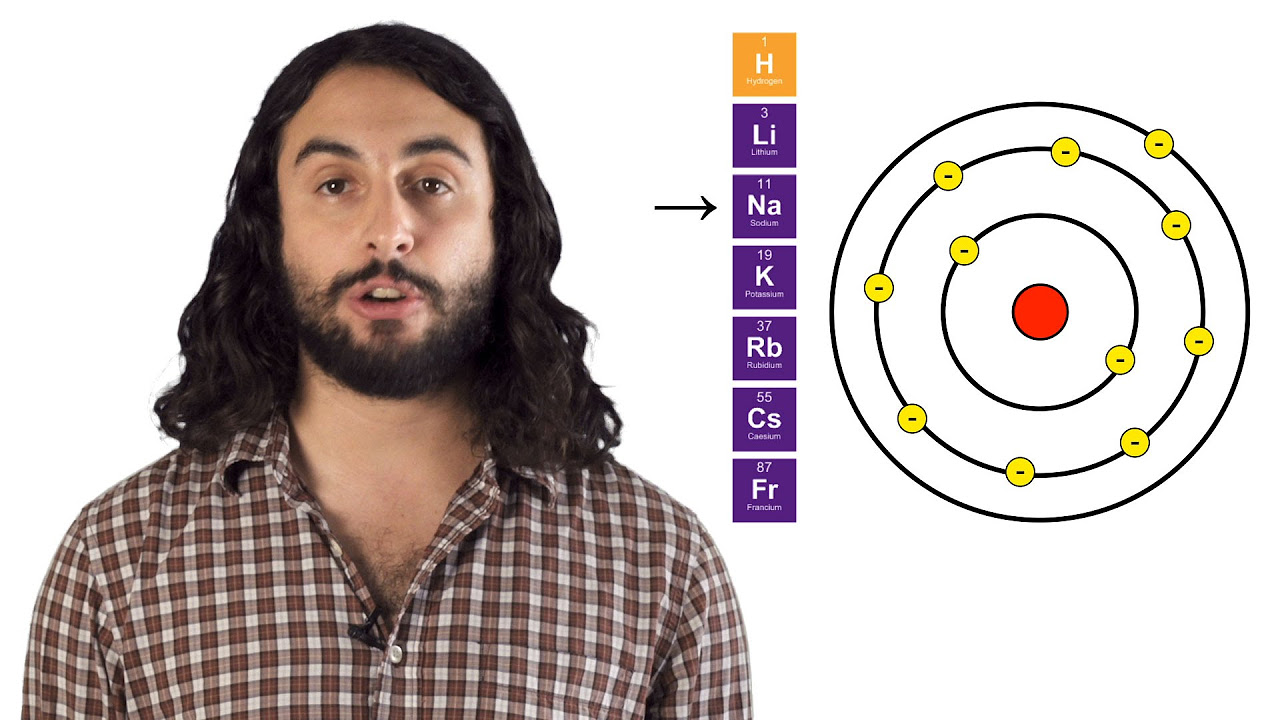
Image taken from the YouTube channel Professor Dave Explains , from the video titled The Periodic Table: Atomic Radius, Ionization Energy, and Electronegativity .
Chemistry, at its core, is the study of matter and its properties, and how matter changes. Understanding these changes requires insight into the fundamental forces that govern the interactions between atoms. Ionization energy is a crucial concept in this realm, acting as a key indicator of an atom's electronic structure and its propensity to form chemical bonds.
Defining Ionization Energy
Ionization energy, in its simplest form, is the energy required to remove an electron from a gaseous atom or ion in its ground state. This seemingly simple definition unlocks a wealth of information about an element's behavior. It reflects the strength with which an atom holds onto its electrons.
The higher the ionization energy, the more tightly bound the electron, and the more difficult it is to remove. This resistance to electron removal is a direct reflection of the attractive forces between the negatively charged electrons and the positively charged nucleus.
The Ionization Energy Chart: A Visual Guide
The Ionization Energy Chart is a powerful tool for visualizing the periodic trends of ionization energy across the elements. By plotting ionization energies against atomic number, distinct patterns emerge, revealing the underlying principles governing the electronic structure of atoms.
This chart isn't just a collection of data points; it's a visual representation of the periodic law, showcasing how the properties of elements vary systematically with their atomic number. Analyzing the peaks and valleys of the chart, we can discern the relative stability of different electron configurations and gain insights into chemical reactivity.
Purpose of This Article
This article aims to serve as a comprehensive guide to understanding the Ionization Energy Chart and the fundamental principles that govern ionization energy. We will delve into the factors that influence ionization energy values, explore the trends observed across the periodic table, and examine the exceptions that challenge the general rules.
By the end of this exploration, you will be equipped with the knowledge to interpret the Ionization Energy Chart, predict the chemical behavior of elements, and appreciate the crucial role of ionization energy in the broader context of chemistry. We will unpack the underlying principles that make this chart such a valuable tool for chemists and students alike.
Chemistry, at its core, is the study of matter and its properties, and how matter changes. Understanding these changes requires insight into the fundamental forces that govern the interactions between atoms. Ionization energy is a crucial concept in this realm, acting as a key indicator of an atom's electronic structure and its propensity to form chemical bonds.
The Ionization Energy Chart is a visual guide to understanding how these atomic properties change across the periodic table. However, to fully appreciate the trends revealed by the chart, we must first establish a firm grasp of the underlying principles that govern the behavior of atoms and their electrons. This involves revisiting key concepts such as the definition of ionization energy itself, the role of electron configuration, and the organization of the periodic table.
Understanding the Basics: Key Concepts for Ionization Energy
Before diving into the intricacies of the Ionization Energy Chart, it's essential to solidify our understanding of the fundamental concepts that underpin this valuable tool. These include a precise definition of ionization energy, an appreciation for the role of electron configuration, and a working knowledge of the periodic table's organization.
Defining Ionization Energy
Ionization energy is defined as the minimum energy required to remove an electron from a gaseous atom or ion in its ground state. This process always requires energy input, making it an endothermic process.
It's crucial to remember that this definition always refers to a gaseous atom. Interactions between atoms in solids or liquids would complicate the energy considerations.
The magnitude of ionization energy serves as a direct measure of how tightly an atom holds onto its electrons. A high ionization energy indicates a strong attraction between the nucleus and the outermost electrons.
The Role of Electron Configuration
An atom's electron configuration describes the arrangement of electrons within its energy levels and sublevels. This arrangement dictates the number of valence electrons, which are the electrons in the outermost shell.
These valence electrons are the ones primarily involved in chemical bonding and are, therefore, directly related to an element’s ionization energy. Elements with nearly full valence shells tend to have very high ionization energies, as they are more stable and less likely to lose electrons.
Conversely, elements with very few valence electrons tend to have lower ionization energies, as they readily lose electrons to achieve a more stable electron configuration.
The Periodic Table: Organizing the Elements
The periodic table is organized by increasing atomic number, which represents the number of protons in an atom's nucleus. The periodic table's structure reflects the recurring chemical properties of elements.
Elements within the same vertical column, known as a group, share similar valence electron configurations and, consequently, exhibit similar chemical behavior. Understanding the periodic table's organization is key to predicting trends in ionization energy.
Ionization Behavior: Selected Groups
Certain groups within the periodic table exhibit characteristic ionization behaviors due to their unique electron configurations:
-
Alkali Metals (Group 1): These elements have only one valence electron, making them very reactive. They readily lose this electron to form a +1 ion and therefore have low ionization energies.
-
Halogens (Group 17): These elements have seven valence electrons, needing only one more to achieve a full outer shell. They have high electron affinities, but their ionization energies are also relatively high due to the strong effective nuclear charge.
-
Noble Gases (Group 18): These elements have a full outer shell of electrons, making them exceptionally stable and unreactive. They possess the highest ionization energies within their respective periods. Because their electron shells are full, it takes a large amount of energy to remove an electron.
Factors Influencing Ionization Energy: A Deep Dive
Having established the fundamental principles, we now turn our attention to the specific factors that dictate the magnitude of ionization energy. These factors intricately intertwine to determine how tightly an atom holds onto its outermost electrons, and understanding them is paramount to interpreting the trends observed in the Ionization Energy Chart.
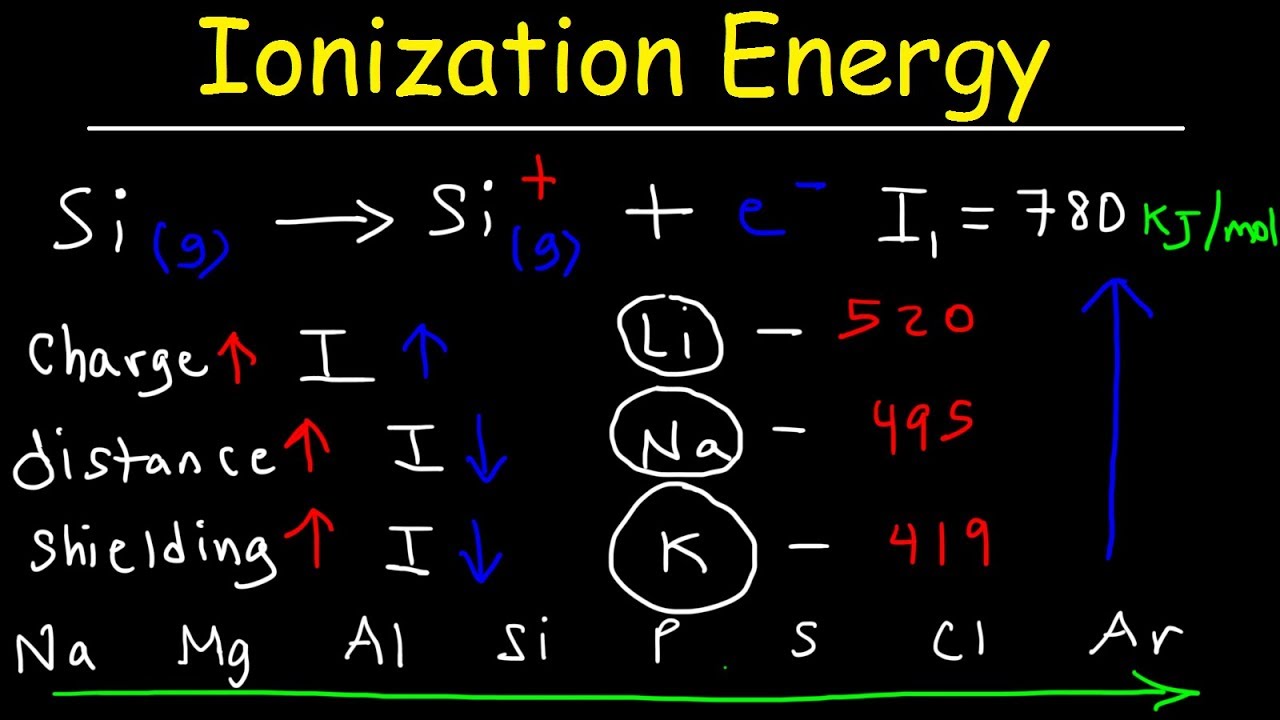
The Role of Atomic Number
The atomic number, representing the number of protons in an atom's nucleus, exerts a direct influence on ionization energy. As the atomic number increases, so does the positive charge of the nucleus.
This heightened positive charge results in a stronger attractive force pulling the electrons inwards. Consequently, more energy is required to overcome this attraction and remove an electron, leading to a higher ionization energy.
In essence, a greater number of protons translates to a tighter grip on the electrons.
Atomic Radius and its Impact
Atomic radius, defined as the distance from the nucleus to the outermost electron shell, plays an inverse role compared to atomic number. As the atomic radius increases, the valence electrons reside further from the nucleus.
This increased distance weakens the electrostatic attraction between the positively charged nucleus and the negatively charged valence electrons.
The diminished attraction implies that less energy is needed to dislodge an electron from its orbit, resulting in a lower ionization energy. Therefore, larger atoms generally exhibit lower ionization energies.
Effective Nuclear Charge: Feeling the Pull
The effective nuclear charge (Zeff) represents the net positive charge experienced by an electron in a multi-electron atom. It’s not simply the atomic number, as the inner electrons shield the outer electrons from the full nuclear charge.
The effective nuclear charge can be approximated by the equation:
Zeff = Z - S
Where:
- Z is the atomic number (number of protons)
- S is the shielding constant (estimated number of core electrons)
A higher effective nuclear charge signifies a stronger attraction between the nucleus and the valence electrons.
As the shielding effect increases, the effective nuclear charge decreases, thereby reducing the ionization energy. Conversely, a higher Zeff correlates with a higher ionization energy, reflecting a stronger pull on the valence electrons.
Shielding Effect: The Inner Electron Barrier
The shielding effect arises from the repulsion between inner-shell electrons and valence electrons. The inner electrons effectively "shield" the valence electrons from the full attractive force of the nucleus.
This shielding reduces the effective nuclear charge experienced by the outer electrons.
The greater the number of inner-shell electrons, the more significant the shielding effect, and the weaker the attraction experienced by the valence electrons. Consequently, less energy is required to remove a valence electron, resulting in a lower ionization energy. The shielding effect explains why ionization energies generally decrease down a group in the periodic table.
Having established the fundamental principles, we now turn our attention to the specific factors that dictate the magnitude of ionization energy. These factors intricately intertwine to determine how tightly an atom holds onto its outermost electrons, and understanding them is paramount to interpreting the trends observed in the Ionization Energy Chart. Let's now translate this knowledge into understanding the patterns and trends that manifest on the Ionization Energy Chart itself.
Deciphering the Ionization Energy Chart: Trends and Patterns
The Ionization Energy Chart is more than just a collection of data points; it's a visual representation of the periodic law and the underlying principles governing atomic structure.
By understanding the trends exhibited on this chart, we can gain valuable insights into the chemical behavior of elements.
General Trends in Ionization Energy
The periodic table organizes elements based on recurring chemical properties, reflecting similarities in their electron configurations. These similarities give rise to predictable trends in ionization energy across periods (rows) and down groups (columns).
Trends Across a Period
As we move from left to right across a period, the ionization energy generally increases. This trend is primarily attributed to the increasing effective nuclear charge (Zeff).
With each step across the period, an additional proton is added to the nucleus.
This leads to a stronger attraction between the nucleus and the valence electrons, requiring more energy to remove an electron.
Though electrons are added in the same principal quantum number, they do not effectively shield each other from the increasing nuclear charge.
Trends Down a Group
Conversely, ionization energy typically decreases as we move down a group.
This is largely due to two factors: increasing atomic radius and increased shielding.
As we descend a group, valence electrons occupy higher energy levels, resulting in a larger atomic radius.
The increased distance between the nucleus and valence electrons weakens the attractive force.
Additionally, the number of inner electron shells increases, providing greater shielding of the valence electrons from the full nuclear charge.
These factors combine to make it easier to remove an electron, thus lowering the ionization energy.
First Ionization Energy
The first ionization energy is defined as the energy required to remove one mole of the outermost electrons from one mole of gaseous atoms.
It is the most readily measured and commonly referenced ionization energy value.
A low first ionization energy suggests an element readily loses an electron to form a positive ion.
Alkali metals, found in Group 1, exemplify this behavior.
Second Ionization Energy and Successive Ionization Energies
Atoms don't just lose one electron; they can lose multiple electrons under the right conditions. Each subsequent electron removal requires a specific amount of energy known as the second ionization energy, third ionization energy, and so on. These are referred to as successive ionization energies.
Removing subsequent electrons becomes progressively more difficult.
This is because with each electron removed, the positive charge of the resulting ion increases, leading to a stronger attraction for the remaining electrons.
A particularly dramatic increase in ionization energy occurs when an atom is forced to remove an electron from a core electron shell, which involves breaking into a noble gas electron configuration.
This is because all the valence electrons have already been removed.
The energy required to remove a core electron is substantially higher because these electrons experience a much greater effective nuclear charge and are held much more tightly.
This phenomenon explains why elements typically form ions with charges corresponding to the number of valence electrons they possess.
Electron Volts (eV): A Unit of Measurement
Ionization energies are commonly expressed in electron volts (eV), a unit of energy convenient for atomic-scale processes. One electron volt is defined as the amount of kinetic energy gained by a single electron accelerating from rest through an electric potential difference of one volt.
While the SI unit of energy is the Joule (J), electron volts are often preferred due to the small magnitude of ionization energies.
The conversion factor between electron volts and Joules is approximately:
1 eV = 1.602 × 10⁻¹⁹ J
Having established the fundamental principles, we now turn our attention to the specific factors that dictate the magnitude of ionization energy. These factors intricately intertwine to determine how tightly an atom holds onto its outermost electrons, and understanding them is paramount to interpreting the trends observed in the Ionization Energy Chart. Let's now translate this knowledge into understanding the patterns and trends that manifest on the Ionization Energy Chart itself.
Anomalies and Exceptions: Breaking the Rules
While the general trends of increasing ionization energy across a period and decreasing ionization energy down a group provide a valuable framework for understanding atomic behavior, the periodic table is not without its exceptions. These deviations from the expected trends offer a deeper insight into the nuances of electron configuration and the stability associated with specific electronic arrangements.
The Significance of Anomalies
These "anomalies," as they're often called, aren't mere statistical noise.
Instead, they are crucial clues that point to the underlying quantum mechanical principles governing electron behavior.
Understanding these exceptions allows for a more refined and accurate prediction of chemical properties and reactivity.
Subshell Stability and Ionization Energy
The stability of electron configurations, particularly those with half-filled or fully-filled subshells, plays a pivotal role in these anomalies. Atoms tend to favor these stable arrangements, making it unexpectedly difficult (or, in some cases, easier) to remove an electron.
Nitrogen vs. Oxygen: A Classic Example
A prime example of this phenomenon is the comparison between nitrogen (N) and oxygen (O).
Following the general trend, one would expect oxygen, with one more proton than nitrogen, to have a higher ionization energy.
However, the opposite is true: nitrogen has a higher first ionization energy than oxygen.
Nitrogen's electron configuration is 1s²2s²2p³, resulting in a half-filled 2p subshell. This half-filled configuration imparts a degree of stability.
Removing an electron from nitrogen disrupts this stable arrangement, requiring more energy.
Oxygen, with an electron configuration of 1s²2s²2p⁴, has four electrons in its 2p subshell.
Removing one electron from oxygen results in a more stable, half-filled 2p³ configuration.
Thus, less energy is needed to remove the first electron from oxygen compared to nitrogen.
Beryllium vs. Boron: Another Notable Exception
A similar, though less dramatic, anomaly can be observed between Beryllium (Be) and Boron (B). Beryllium has a filled 2s subshell (1s²2s²), providing extra stability. Boron (1s²2s²2p¹) does not have a full or half-filled subshell. Thus, it is slightly easier to remove the 2p¹ electron from Boron as compared to Beryllium.
Factors Contributing to Subshell Stability
Several factors contribute to the stability of half-filled and fully-filled subshells.
These include:
- Symmetrical Distribution of Charge: Electrons in half-filled or fully-filled subshells are distributed symmetrically in space, minimizing electron-electron repulsion.
- Exchange Energy: Quantum mechanics dictates that electrons with the same spin can "exchange" places, leading to a stabilizing effect known as exchange energy. This effect is maximized in half-filled and fully-filled subshells, where there are more possible exchanges.
Recognizing and Interpreting Anomalies
Identifying these anomalies requires a careful analysis of the ionization energy chart and a solid understanding of electron configurations.
When encountering a deviation from the general trends, consider the following:
- Electron Configuration: Determine the electron configuration of the element and its resulting ion after ionization.
- Subshell Stability: Assess whether the electron configuration involves a half-filled or fully-filled subshell.
- Other Factors: Consider other factors, such as relativistic effects in heavier elements, which can also influence ionization energies.
By understanding and interpreting these anomalies, one can gain a much more nuanced and complete picture of the factors governing atomic behavior and chemical reactivity. The "exceptions" truly prove the rule, enriching our understanding of ionization energy and its implications.
Having navigated the intricacies of ionization energy trends and their occasional deviations, we arrive at a crucial question: what is the practical value of this knowledge? Understanding ionization energy isn't just an academic exercise; it's a powerful tool for predicting and explaining chemical behavior in the real world. Let's now turn to the tangible applications of ionization energy data, exploring how it informs our understanding of chemical reactivity and oxidation states.
Applications of Ionization Energy Data: Predicting Chemical Behavior
Ionization energy is more than just a number on a chart; it's a window into the soul of an atom, revealing its propensity to form chemical bonds and participate in reactions.
By understanding how easily an atom loses electrons, we gain valuable insights into its chemical behavior.
Predicting Chemical Reactivity
The ionization energy of an element is directly related to its chemical reactivity.
Elements with low ionization energies readily lose electrons to form positive ions (cations), making them highly reactive, especially with elements that readily gain electrons.
Alkali Metals: Eager Electron Donors
The alkali metals, found in Group 1 of the periodic table, exemplify this principle. Their low first ionization energies mean they readily lose a single electron to achieve a stable electron configuration, resulting in vigorous reactions with elements like halogens.
Consider the reaction between sodium (Na) and chlorine (Cl) to form sodium chloride (NaCl), common table salt.
Sodium, with its low ionization energy, readily donates an electron to chlorine, which has a high electron affinity. This electron transfer drives the formation of a stable ionic bond, releasing a significant amount of energy in the process.
Noble Gases: The Inert Exception
In stark contrast, noble gases possess exceptionally high ionization energies. This reflects their already stable, filled valence shells, making it energetically unfavorable to remove an electron.
As a result, they are generally inert and do not readily participate in chemical reactions.
Understanding Oxidation States
Ionization energies also provide a framework for understanding and predicting the common oxidation states of elements.
Oxidation state, also known as oxidation number, represents the hypothetical charge an atom would have if all bonds were completely ionic.
The energy required to remove successive electrons from an atom increases dramatically after all valence electrons have been removed.
This significant jump in ionization energy explains why elements typically exhibit oxidation states corresponding to the number of their valence electrons.
Magnesium: A Tale of Two Electrons
Magnesium (Mg), for example, has two valence electrons. Its first and second ionization energies are relatively low, reflecting the ease of removing these two electrons to achieve a stable electron configuration.
However, the third ionization energy of magnesium is significantly higher.
This substantial increase indicates that removing a third electron would disrupt the stable, filled electron shell, requiring a large energy input.
Consequently, magnesium almost exclusively exists in the +2 oxidation state (Mg²⁺) in its compounds.
Transition Metals: Variable Oxidation States
Transition metals, with their partially filled d orbitals, often exhibit multiple oxidation states.
The relatively small differences between successive ionization energies allow for the removal of varying numbers of d electrons, resulting in a range of stable oxidation states.
For example, iron (Fe) commonly exists in both +2 (Fe²⁺) and +3 (Fe³⁺) oxidation states, reflecting the accessibility of different numbers of d electrons for bonding.
By analyzing ionization energy data, chemists can gain a deeper understanding of why certain elements prefer specific oxidation states and how these preferences influence the formation of chemical compounds.
Video: Ionization Energy Chart: Unlock the Secrets (Explained!)
FAQs: Ionization Energy Chart Explained
Confused about the ionization energy chart? Here are some frequently asked questions to help you better understand this valuable tool.
What exactly does the ionization energy chart show?
The ionization energy chart illustrates the trend of ionization energy across the periodic table. It specifically displays how the energy required to remove an electron from an atom changes as you move across periods (rows) and down groups (columns). The chart helps visualize these patterns.
Why does ionization energy generally increase across a period?
As you move from left to right across a period, the number of protons in the nucleus increases, leading to a stronger positive charge. This stronger attraction between the nucleus and the electrons makes it harder to remove an electron, thus increasing the ionization energy. The ionization energy chart visualizes this increasing trend.
What does a large jump in ionization energy indicate?
A significant jump in ionization energy usually indicates that you've removed all of the valence electrons. The next electron you're trying to remove is from a filled electron shell closer to the nucleus. This requires considerably more energy, which is apparent on the ionization energy chart.
How can I use the ionization energy chart to predict an element's reactivity?
Elements with low ionization energies tend to be more reactive because they readily lose electrons to form positive ions. By observing the trends on the ionization energy chart, you can infer relative reactivities of different elements. Elements with higher ionization energies require more energy to lose electrons, hence they are less reactive.
So, there you have it! Hopefully, you've now got a good handle on the ionization energy chart and its importance. Happy exploring!