Population Standard Deviation: Demystified!
Statistics, as a powerful tool, relies on measures like population standard deviation to understand data variability. The Central Limit Theorem provides theoretical foundations relevant to interpreting this variability within populations. For researchers, accurately calculating population standard deviation enables meaningful conclusions about their datasets. Even institutions like the National Institute of Standards and Technology (NIST) recognize the importance of population standard deviation in ensuring precise measurements, underlining its broad applicability in various fields.
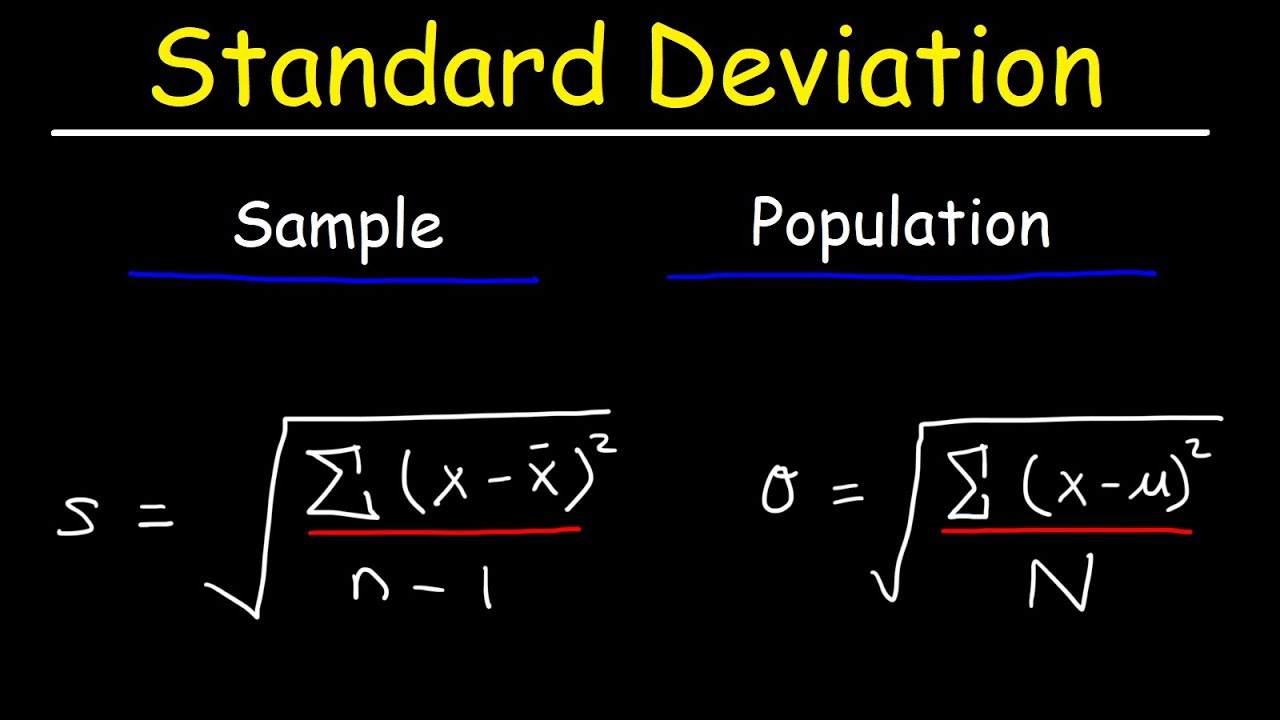
Image taken from the YouTube channel The Organic Chemistry Tutor , from the video titled Standard Deviation Formula, Statistics, Variance, Sample and Population Mean .
In the realm of statistical analysis, understanding the characteristics of a dataset is paramount. Data rarely exists as a uniform collection of identical values. Instead, it exhibits variability – a natural tendency for individual data points to differ from one another. This variability is not a flaw, but a fundamental property that reflects the diversity and complexity of the world we seek to understand.
The Significance of Data Spread
Imagine analyzing the heights of all adults in a country. You wouldn't expect everyone to be the exact same height. Instead, you'd observe a range, with some individuals being taller and others shorter than the average. This spread of data points around the average is crucial for gaining meaningful insights.
Understanding this spread, or dispersion, allows us to move beyond simply knowing the average value. It enables us to:
-
Assess the reliability of the average as a representation of the entire population.
-
Identify potential outliers – data points that deviate significantly from the norm.
-
Compare the variability of different datasets, even if their averages are similar.
Population Standard Deviation: A Definition
Population standard deviation serves as a critical tool for quantifying and interpreting this spread.
Population standard deviation (represented by the symbol σ) is a measure of the average distance of individual data points from the mean (average) of the entire population.
In essence, it tells us how tightly clustered or widely dispersed the data points are around the population mean. A low standard deviation indicates that the data points tend to be close to the mean, while a high standard deviation suggests that they are more spread out.
Understanding and calculating the population standard deviation allows for a more comprehensive and nuanced analysis, leading to more informed and accurate conclusions. It's not just about finding the average, but also about understanding the typical deviation from that average within the complete population dataset.
In essence, it tells us how tightly clustered or widely dispersed the data points are around the population mean. A low standard deviation indicates that the data points tend to cluster closely around the mean, while a high standard deviation suggests a wider spread. Before we can harness the power of population standard deviation, however, we need to establish a solid foundation of understanding.
Fundamentals of Standard Deviation: A Deep Dive
To truly grasp the meaning and utility of population standard deviation, we must first define its core components and related concepts. This involves understanding what it fundamentally measures, differentiating it from its counterpart (sample standard deviation), exploring the concept of variance, recognizing the significance of the sigma symbol, and clarifying the role of deviation itself.
Defining Standard Deviation: Measuring Data Spread
At its heart, standard deviation provides a numerical summary of the spread or dispersion within a dataset. More specifically, it quantifies the average distance of individual data points from the mean (average) of the dataset.
It's crucial to remember that standard deviation doesn't simply tell us the range of values; instead, it provides a sense of how tightly or loosely the data points are clustered around the central tendency (the mean).
Population Standard Deviation vs. Sample Standard Deviation
While both population and sample standard deviations measure data spread, they differ in their scope and calculation. Population standard deviation (which is our focus here) considers every single data point within the entire population. This is often theoretical, because it can be difficult or impossible to get data from every member of a population.
In contrast, sample standard deviation is calculated from a subset (a sample) of the population and is used to estimate the population standard deviation. The formulas differ slightly (more on that later) to account for the fact that a sample might not perfectly represent the entire population.
Exploring Variance: The Square of the Spread
Variance is closely related to standard deviation, serving as an intermediary step in its calculation.
Variance is defined as the average of the squared differences between each data point and the mean. In simpler terms, it's the square of the standard deviation.
While standard deviation is expressed in the same units as the original data, variance is expressed in squared units.
Although variance is less intuitive to interpret directly, it plays a crucial role mathematically and is often used in more advanced statistical analyses.
Introducing Sigma (σ): The Symbol of Population Spread
The Greek letter sigma (σ) is the universally recognized symbol for population standard deviation. It's a shorthand way of referring to this important statistical measure.
In mathematical formulas, σ typically appears alongside other symbols representing the population mean (μ) and the individual data points (xi). Understanding the meaning of σ is essential for interpreting statistical equations and research findings.
The Role of Deviation: Measuring Individual Differences
Deviation refers to the difference between a single data point and the mean of the dataset.
For example, if the average test score is 75, and a student scores 80, their deviation is +5. If another student scores 70, their deviation is -5.
Deviations can be positive or negative, indicating whether a data point is above or below the mean, respectively.
The concept of deviation is fundamental to understanding standard deviation, as the latter essentially summarizes the average magnitude of these deviations across the entire population.
Of course! Here is the content you requested:
Calculating Population Standard Deviation: A Practical Guide
Understanding the conceptual underpinnings of population standard deviation is essential, but the ability to calculate it accurately is where theory meets practice. Let's delve into a step-by-step approach to demystify this process.
This practical guide breaks down the calculation into manageable steps, ensuring a clear understanding of how to arrive at the final figure.
Step 1: Calculate the Mean (Average) of the Population Data Set
The foundation of standard deviation lies in understanding the central tendency of the data, which is represented by the mean. To calculate the population mean (often denoted by the Greek letter μ), we simply sum all the values in the population dataset and divide by the total number of values (N).
Mathematically, this is represented as:
μ = (Σxᵢ) / N
Where:
- μ is the population mean.
- Σxᵢ represents the sum of all individual data points.
- N is the total number of data points in the population.
For instance, if our population dataset consists of the values {2, 4, 6, 8, 10}, the population mean would be (2+4+6+8+10) / 5 = 6. This provides the central reference point against which deviations will be measured.
Step 2: Determine the Deviation of Each Data Point from the Mean (Average)
Once we have the population mean, the next step involves calculating the deviation of each individual data point from this mean. The deviation represents the difference between each data point (xᵢ) and the population mean (μ).
Deviation = xᵢ - μ
Continuing with our example dataset {2, 4, 6, 8, 10} and a mean of 6:
- The deviation for 2 is 2 - 6 = -4.
- The deviation for 4 is 4 - 6 = -2.
- The deviation for 6 is 6 - 6 = 0.
- The deviation for 8 is 8 - 6 = 2.
- The deviation for 10 is 10 - 6 = 4.
These deviations tell us how far each data point strays from the average.
Step 3: Square Each Deviation
A crucial step in calculating population standard deviation is to square each of the deviations calculated in the previous step. This serves two important purposes.
First, it eliminates negative signs, ensuring that deviations below the mean don't cancel out deviations above the mean.
Second, squaring the deviations gives more weight to larger deviations, reflecting their greater contribution to the overall spread of the data.
Using our ongoing example:
- (-4)² = 16
- (-2)² = 4
- (0)² = 0
- (2)² = 4
- (4)² = 16
Squaring the deviations provides a measure of the magnitude of each data point's variance from the mean, irrespective of direction.
Step 4: Calculate the Variance by Averaging the Squared Deviations
Variance, denoted by σ², is a measure of the average squared deviation from the mean. To calculate the population variance, we sum the squared deviations calculated in the previous step and divide by the total number of data points in the population (N).
Mathematically:
σ² = Σ(xᵢ - μ)² / N
Applying this to our dataset:
σ² = (16 + 4 + 0 + 4 + 16) / 5 = 8
The population variance of 8 indicates the average squared distance of data points from the mean.
Step 5: Calculate the Standard Deviation by Taking the Square Root of the Variance
Finally, to arrive at the population standard deviation (σ), we simply take the square root of the variance (σ²). This returns the measure of spread to its original unit of measurement, making it more interpretable.
σ = √σ²
In our example:
σ = √8 ≈ 2.83
Therefore, the population standard deviation for the dataset {2, 4, 6, 8, 10} is approximately 2.83. This value represents the typical distance that data points in this population deviate from the mean. It's a key indicator of the data's dispersion.
Once the deviation for each point is known, squaring each is a crucial step toward understanding overall data spread. But why go through all this trouble? The magic truly unfolds when we start to see how these calculations translate into real-world insights.
Significance and Real-World Applications of Population Standard Deviation
Population standard deviation isn't just a mathematical abstraction; it's a powerful tool that unlocks profound insights across diverse fields. Its significance lies in its ability to provide a quantifiable measure of data spread, enabling informed decision-making and a deeper understanding of population characteristics.
Unveiling Data Distributions
Standard deviation is invaluable for interpreting data because it allows us to understand the distribution and spread of values around the mean. A small standard deviation indicates that the data points are clustered closely around the average, suggesting a homogeneous population. Conversely, a large standard deviation signifies greater variability, implying a more heterogeneous population.
Knowing the standard deviation enriches our understanding beyond simply knowing the average. For example, consider two datasets representing the average income in two different cities. Both might have the same average income, but if one city has a significantly lower standard deviation, it suggests a more equitable distribution of wealth.
The Power of Population Insights
Understanding population statistics is paramount for effective governance, resource allocation, and policy development. Population standard deviation is a crucial component in this understanding. It allows us to assess the reliability of our estimates and to make more informed predictions about future trends.
Imagine a scenario where a public health organization is trying to assess the effectiveness of a new vaccination program. By analyzing the standard deviation of infection rates before and after the program, they can determine whether the intervention has had a consistent and significant impact across the population.
Real-World Applications Across Industries
The applications of population standard deviation extend far beyond theoretical exercises. Its ability to quantify variability makes it indispensable in many sectors:
Healthcare
In healthcare, standard deviation is used to assess the consistency of treatment outcomes, to identify outliers in patient data, and to monitor the quality of care. It also plays a critical role in clinical trials, helping researchers determine the effectiveness and safety of new drugs and therapies. For example, monitoring the standard deviation of blood pressure readings for patients on a new medication.
Finance
In finance, standard deviation is a key metric for assessing investment risk. It measures the volatility of asset prices, helping investors understand the potential range of returns and make informed decisions about portfolio allocation. Lower standard deviation indicates lower volatility and safer investments. Higher standard deviation indicates higher risk, but also potentially higher returns.
Engineering
Engineers use standard deviation to ensure the quality and reliability of products and processes. It helps them quantify the variability in manufacturing processes, identify potential sources of error, and optimize designs for robustness and consistency. Consider an engineer designing a bridge; understanding the standard deviation of the load-bearing capacity of the materials is crucial for ensuring structural integrity.
Once we appreciate the power of population standard deviation, a crucial distinction arises: the difference between population and sample standard deviation. Failing to recognize this difference can lead to inaccurate interpretations and flawed analyses. Therefore, a closer look at these two measures is warranted.
Population vs. Sample Standard Deviation: Key Differences
In the realm of statistics, the terms "population" and "sample" carry significant weight. The population refers to the entire group you're interested in studying. This could be all registered voters in a country, every tree in a forest, or each widget produced in a factory during a specific period.
A sample, on the other hand, is a subset of that population, carefully selected to represent the larger group. Because examining an entire population is often impractical or impossible due to resource constraints, sampling is a common practice.
Why Samples Aren't Perfect Mirrors
While a well-chosen sample aims to mirror the characteristics of the population, it's crucial to acknowledge that it will never be a perfect replica. This inherent imperfection stems from the fact that a sample inherently excludes some members of the population. That exclusion inevitably leads to a degree of uncertainty when extrapolating findings from the sample back to the entire population.
Introducing Bessel's Correction: Accounting for Uncertainty
Given the potential for underestimation of variability when working with samples, statisticians employ a technique known as Bessel's correction. This correction involves adjusting the formula for sample standard deviation to account for the fact that a sample tends to underestimate the true population variance.
Specifically, Bessel's correction modifies the denominator in the variance calculation from 'N' (the population size) to 'n-1' (the sample size minus one). This seemingly small adjustment increases the calculated sample standard deviation, providing a more accurate estimate of the population's true variability.
The Formulaic Difference
To illustrate, the formula for population standard deviation uses 'N' (population size) in the denominator:
σ = √[ Σ ( xi - μ )2 / N ]
Whereas the formula for sample standard deviation uses 'n-1' (sample size minus 1):
s = √[ Σ ( xi - x̄ )2 / (n-1) ]
This seemingly minor change is vital for ensuring that the sample standard deviation provides an unbiased estimate of the population standard deviation.
Choosing the Right Tool for the Job
The decision to use population or sample standard deviation hinges on the nature of your data. If you have data for the entire population, use the population standard deviation formula. If you're working with a sample, use the sample standard deviation formula, incorporating Bessel's correction. Using the correct formula ensures that your statistical analyses are accurate and reliable.
In cases where the sample size is a substantial portion of the population, the difference between the two calculations becomes less pronounced. However, it is still important to use the correct formula based on whether you are analyzing a population or a sample. Choosing the right calculation depends on correctly defining the scope of inference.
Video: Population Standard Deviation: Demystified!

Population Standard Deviation: FAQs
Here are some frequently asked questions to help clarify your understanding of population standard deviation.
What exactly does population standard deviation measure?
Population standard deviation measures the average amount of dispersion within an entire population. It tells you how spread out the data points are from the population mean. A higher standard deviation indicates greater variability, while a lower value signifies that data points are clustered more closely around the mean.
How does population standard deviation differ from sample standard deviation?
Population standard deviation considers every individual in the entire population, while sample standard deviation only considers a subset (sample) of the population. The formulas also differ slightly, with sample standard deviation using n-1 in the denominator to account for the fact that it's an estimate of the population parameter.
When is it appropriate to calculate the population standard deviation?
You should calculate the population standard deviation when you have data for the entire population you are interested in. If you only have a sample, you should use the sample standard deviation instead. This is crucial for accurate statistical analysis.
What units are used for the population standard deviation?
The units of the population standard deviation are the same as the units of the original data. For example, if your data is in kilograms, the population standard deviation will also be in kilograms. This makes it easy to interpret the standard deviation in the context of your data.