Unlock Lithium's Secrets: Emission Spectra Explained!
Atomic Emission Spectroscopy, a cornerstone of analytical chemistry, offers a powerful means to investigate the unique signature of elements. Lithium, pivotal in battery technology and psychiatric treatment, exhibits a characteristic emission spectrum. The National Institute of Standards and Technology (NIST) maintains comprehensive databases of spectral lines, including those for lithium, aiding researchers worldwide. These databases allow scientists at institutions like the Massachusetts Institute of Technology (MIT) to conduct precise studies on the *emission spectra of lithium*. Understanding these spectra unlocks insights into the electronic structure of lithium and its interactions within various environments.
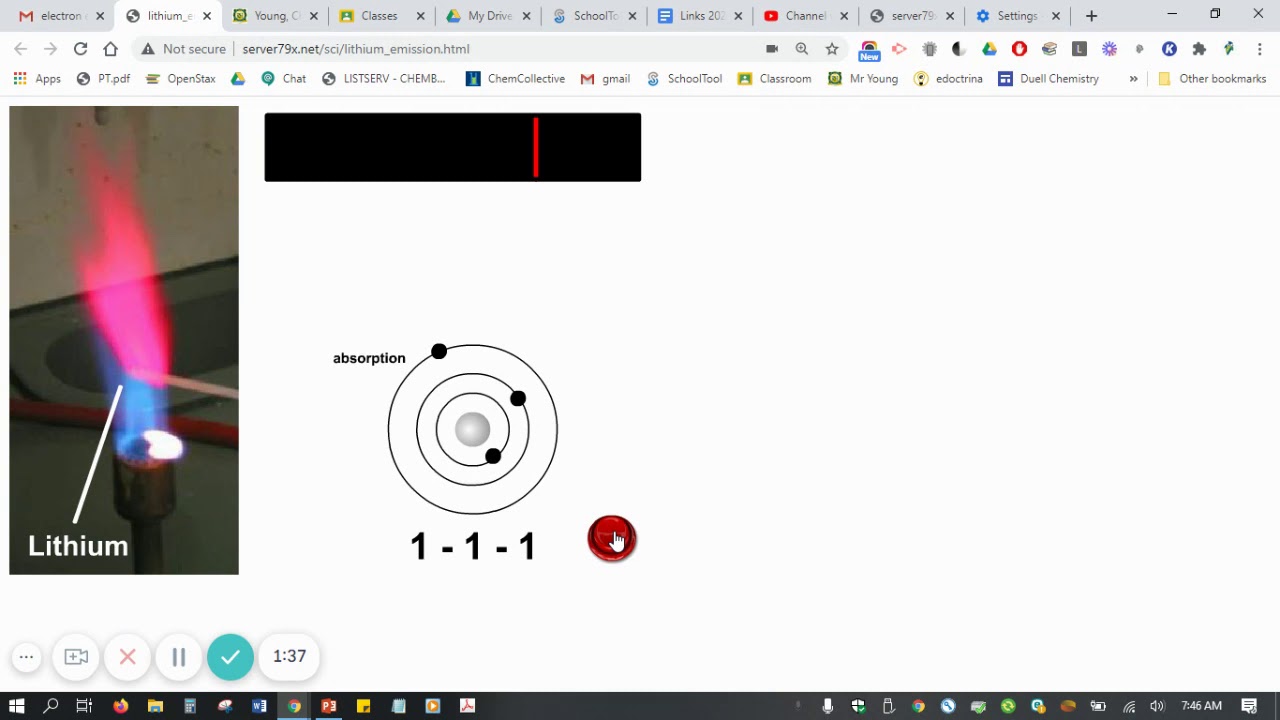
Image taken from the YouTube channel Christopher Young , from the video titled Flash Demo - Lithium Emission Walkthrough .
Lithium (Li), the lightest of all metals, holds a pivotal role in a diverse array of applications that touch nearly every facet of modern life. From powering our mobile devices and electric vehicles with its presence in advanced batteries, to its critical use as a mood-stabilizing medication in mental health treatment, lithium’s impact is undeniable.
Its use extends further into industries like aerospace, where it's alloyed with aluminum to create lightweight, high-strength materials.
But beyond its practical utility, lithium possesses an intrinsic scientific allure. Each element, like a human fingerprint, exhibits a unique spectral signature. This signature, a pattern of light emitted when the element is excited, provides a powerful tool for identification and analysis.
This "fingerprint" manifests as an emission spectrum, a concept at the heart of spectroscopic analysis.
The Spectroscopic Key to Lithium's Identity
An emission spectrum is essentially a bar code of light, specific to each element. When elements are heated or subjected to an electrical discharge, their atoms absorb energy and become "excited."
This excitation prompts electrons to jump to higher energy levels, only to fall back down to their original state almost immediately. This "fall" releases the absorbed energy in the form of photons – packets of light.
The wavelength of these photons is directly related to the energy difference between the electron energy levels, and this relationship determines the color of the emitted light. Because the energy levels within an atom are quantized (meaning they can only exist at specific, discrete values), the emitted photons have very specific wavelengths. This results in a unique pattern of colored lines, which forms the element's emission spectrum.
Thesis: Exploring the Science and Applications
This article delves into the fascinating world of lithium's emission spectra. We will explore the fundamental scientific principles that govern these spectral fingerprints, and we will then examine the practical techniques used to observe and analyze them.
The goal is to highlight the invaluable role of lithium emission spectra analysis across a range of scientific and industrial applications. From determining the composition of distant stars to monitoring lithium levels in pharmaceutical production, the study of these spectral signatures unlocks insights and capabilities that are essential to modern science and technology.
The wavelength of these photons is directly related to the energy difference between the electron energy levels, and this relationship determines the color of the emitted light. Because the energy levels within an atom are quantized (meaning they can only exist at specific, discrete values), the emitted light also consists of discrete wavelengths. This brings us to the heart of understanding emission spectra, a key concept for identifying and analyzing elements like lithium.
Emission Spectra: A Fundamental Overview
An emission spectrum is much more than just a pretty pattern of light.
It's a unique signature, a fingerprint of an element, revealing its atomic composition. It represents the specific wavelengths of light emitted by an element when its atoms return from an excited state to a lower energy state. These wavelengths appear as distinct lines (or bands, in the case of molecules) in the spectrum.
Each element has its own unique arrangement of electrons and energy levels. Therefore, the emission spectrum serves as a reliable tool for identifying the presence of that element in a sample.
The Genesis of Emission Spectra: Atomic Excitation and Photon Emission
Emission spectra are generated through a fascinating sequence of events at the atomic level. It begins with the excitation of atoms.
When an atom absorbs energy – typically from heat, electricity, or light – one or more of its electrons jump from their normal, or ground state, to a higher energy level.
Think of it as an electron climbing a ladder to a higher rung.
However, this excited state is unstable. The electron wants to return to its lower energy state, much like wanting to step back down from the ladder.
When the electron falls back down to a lower energy level, it releases the energy it absorbed in the form of a photon, a particle of light.
The energy of this photon is precisely equal to the energy difference between the two energy levels involved in the transition.
Because energy is directly related to wavelength, this means that photons of specific wavelengths are emitted.
Electron Transitions: The Dance of Energy Levels
The electron transitions between energy levels are the key to understanding the emission spectrum.
Each possible transition corresponds to a specific energy difference and, therefore, a specific wavelength of emitted light.
For example, when Lithium (Li) atoms are excited, their electrons may jump to various higher energy levels.
When these electrons return to lower levels, they emit photons with wavelengths characteristic of lithium.
The most prominent line in lithium's visible emission spectrum is a bright red line, corresponding to a specific electron transition.
Wavelength, Frequency, and Energy: An Intertwined Relationship
The relationship between energy levels, wavelength, and frequency is fundamental to understanding emission spectra.
The energy (E) of a photon is inversely proportional to its wavelength (λ) and directly proportional to its frequency (ν), as described by the following equations:
E = hc/λ
E = hν
where 'h' is Planck's constant and 'c' is the speed of light.
This means that higher-energy transitions result in shorter wavelengths (e.g., ultraviolet light) and higher frequencies, while lower-energy transitions result in longer wavelengths (e.g., infrared light) and lower frequencies.
Thus, the specific pattern of wavelengths observed in an element's emission spectrum provides a unique "fingerprint" of that element, stemming directly from its quantized energy levels and electron transitions. This is the power and the beauty of spectroscopic analysis.
Emission spectra, as we've explored, provide a window into the atomic world, revealing the unique energy transitions that define an element. But the beauty of the spectrum lies not just in its existence, but in the specific wavelengths that compose it. For lithium, these wavelengths form a distinctive pattern, a spectral fingerprint that sets it apart from all other elements.
Lithium's Distinct Spectral Signature
Lithium's emission spectrum isn't a continuous rainbow; it's a series of discrete, colored lines against a dark background. These lines correspond to specific wavelengths of light emitted when excited lithium atoms return to their ground state.
The most prominent line in lithium's visible spectrum is a strong red-orange line at approximately 670.8 nm. This is the line that most people associate with lithium and is often used for its identification. However, other lines exist, though they may be less intense or fall outside the easily visible range. These include lines in the blue-green region of the spectrum.
Unpacking the 670.8 nm Wavelength
The intense red-orange line at 670.8 nm is particularly important because it is very easily excited, so it is very useful for lithium detection. This wavelength corresponds to a specific energy transition within the lithium atom. Specifically, it corresponds to the transition of an electron from the 2p to the 2s orbital.
The precise energy difference between these orbitals dictates the wavelength of the emitted photon. This relationship is governed by the fundamental equation E = hc/λ, where E is energy, h is Planck's constant, c is the speed of light, and λ is the wavelength.
The Role of Quantum Mechanics
The existence of these discrete spectral lines isn't arbitrary. It is a direct consequence of the principles of quantum mechanics. Quantum mechanics dictates that electrons in an atom can only occupy specific, quantized energy levels. Electrons cannot exist at energy levels between these allowed states.
When an electron transitions from one energy level to another, it emits or absorbs energy in the form of a photon. The energy of this photon is precisely equal to the difference in energy between the two levels.
Because the energy levels are quantized, the energy of the emitted photons is also quantized, resulting in the discrete spectral lines we observe. If energy levels could take on any value (that is, energy levels were not quantized), then the spectra would be continuous.
Bohr, Balmer, and the Dawn of Atomic Understanding
The observation and analysis of spectral lines played a pivotal role in the development of early atomic theory.
Niels Bohr, building upon the work of Max Planck and Albert Einstein, proposed a model of the atom in which electrons orbited the nucleus in specific, quantized energy levels. Bohr's model successfully explained the discrete nature of atomic spectra, particularly the spectrum of hydrogen.
While Bohr's model was eventually superseded by more sophisticated quantum mechanical models, it was a crucial stepping stone in our understanding of atomic structure and the origin of spectral lines.
Johann Balmer, before Bohr, developed an empirical formula that accurately predicted the wavelengths of the visible spectral lines of hydrogen. Balmer's formula provided a mathematical relationship between the wavelengths, but it wasn't until Bohr's model that a theoretical explanation for this relationship was developed. The convergence of empirical observation (Balmer) and theoretical modeling (Bohr) cemented the importance of emission spectra as tools for understanding the fundamental nature of matter.
Emission spectra, as we've explored, provide a window into the atomic world, revealing the unique energy transitions that define an element. But the beauty of the spectrum lies not just in its existence, but in the specific wavelengths that compose it. For lithium, these wavelengths form a distinctive pattern, a spectral fingerprint that sets it apart from all other elements.
Techniques for Observing Lithium's Emission
The observation and analysis of lithium's emission spectrum rely on sophisticated analytical techniques. These methods allow scientists to not only identify the presence of lithium, but also to precisely measure its concentration in a variety of samples. Two prominent techniques used are Atomic Emission Spectroscopy (AES) and Flame Emission Spectroscopy (FES). Each technique leverages the principle of exciting lithium atoms and analyzing the emitted light, but they differ in their excitation methods and specific applications.
Atomic Emission Spectroscopy (AES)
Atomic Emission Spectroscopy (AES) is a powerful analytical technique used to determine the elemental composition of a sample. It is based on the principle that atoms, when excited by high temperatures, emit light at specific wavelengths. These wavelengths are unique to each element, providing a fingerprint that allows for both qualitative and quantitative analysis.
The process begins with the introduction of a sample into a high-temperature plasma or arc. This high-energy environment causes the atoms in the sample to become excited. As the excited atoms return to their ground state, they release energy in the form of photons, each with a specific wavelength corresponding to the energy difference between the excited and ground states.
The emitted light is then passed through a spectrometer, which separates the light into its constituent wavelengths. A detector measures the intensity of each wavelength, providing a spectrum of the emitted light. The presence of lithium is indicated by the presence of its characteristic spectral lines, most notably the strong red-orange line at 670.8 nm. The intensity of these lines is directly proportional to the concentration of lithium in the sample, enabling quantitative analysis.
Types of Spectrometers Used in AES
Various types of spectrometers are used in AES, each with its own advantages and limitations. Common types include:
-
Prism Spectrometers: These use a prism to refract the light and separate it into its different wavelengths. While simple in design, they may suffer from non-linear dispersion.
-
Grating Spectrometers: These use a diffraction grating to separate the light. Grating spectrometers offer higher resolution and linear dispersion, making them more suitable for complex samples.
-
Inductively Coupled Plasma Atomic Emission Spectrometers (ICP-AES): This type of AES utilizes an inductively coupled plasma (ICP) to excite the atoms in the sample. ICP-AES is known for its high sensitivity, stability, and ability to analyze a wide range of elements simultaneously. The ICP source is generated by passing argon gas through a radio-frequency field, creating a high-temperature plasma that efficiently excites the atoms.
Flame Emission Spectroscopy (FES)
Flame Emission Spectroscopy (FES), also known as Flame Photometry, is another technique used to analyze lithium and other alkali metals. In FES, the sample is introduced into a flame, which serves as the excitation source. The heat of the flame causes the lithium atoms to become excited. As these excited atoms return to their ground state, they emit light at characteristic wavelengths.
The emitted light passes through a filter or monochromator, which isolates the specific wavelength of interest (e.g., 670.8 nm for lithium). A detector then measures the intensity of the emitted light, which is proportional to the concentration of lithium in the sample.
Advantages and Limitations of FES for Analyzing Lithium
FES offers several advantages, including its simplicity, relatively low cost, and ease of use. It is particularly well-suited for the analysis of alkali metals like lithium, which are easily excited in a flame. The technique requires less sophisticated instrumentation compared to AES, making it accessible to a wider range of laboratories.
However, FES also has limitations.
-
Lower Sensitivity: FES typically has lower sensitivity compared to AES techniques like ICP-AES. This means that it may not be suitable for analyzing samples with very low concentrations of lithium.
-
Interference: The flame can introduce background emission and spectral interferences, which can affect the accuracy of the analysis. Careful selection of the flame conditions and the use of appropriate filters or monochromators are necessary to minimize these interferences.
-
Matrix Effects: The presence of other elements in the sample (the matrix) can also affect the emission of lithium, leading to inaccuracies. Standard addition methods or matrix matching techniques may be required to correct for these matrix effects.
Despite these limitations, FES remains a valuable technique for the routine analysis of lithium in various applications, especially when high sensitivity is not a primary requirement.
Emission spectra, as we've explored, provide a window into the atomic world, revealing the unique energy transitions that define an element. But the beauty of the spectrum lies not just in its existence, but in the specific wavelengths that compose it. For lithium, these wavelengths form a distinctive pattern, a spectral fingerprint that sets it apart from all other elements.
And it's this very uniqueness that makes the analysis of lithium's emission spectra so valuable. Moving beyond mere observation, these analytical techniques unlock a wealth of practical applications, transforming spectral data into actionable insights across diverse scientific and industrial domains.
Applications of Lithium Emission Spectra Analysis
The power of analyzing lithium's emission spectra lies in its ability to provide both qualitative and quantitative information. Qualitative analysis allows us to confidently identify the presence of lithium in a sample, while quantitative analysis enables the precise determination of its concentration. These capabilities underpin a wide range of applications, from environmental monitoring to pharmaceutical quality control.
Qualitative Analysis: Identifying Lithium's Presence
At its core, qualitative analysis using emission spectra is about identification. By comparing the observed spectrum of an unknown sample to the known spectrum of lithium, we can determine whether lithium is present.
This is achieved by looking for the characteristic emission lines of lithium – the specific wavelengths of light that lithium atoms emit when excited. If these lines are present in the sample's spectrum, it confirms the presence of lithium.
This method is particularly useful in situations where lithium might be unexpected, or where its presence needs to be rapidly confirmed. For example, in geological surveys, emission spectroscopy can quickly identify lithium-bearing minerals.
Quantitative Analysis: Measuring Lithium Concentration
While qualitative analysis tells us if lithium is present, quantitative analysis tells us how much is present. This is crucial in applications where the concentration of lithium is critical, such as in pharmaceutical manufacturing or battery production.
The principle behind quantitative analysis is that the intensity of the emitted light at lithium's characteristic wavelengths is directly proportional to the concentration of lithium in the sample. By carefully calibrating the instrument with known standards, we can establish a relationship between light intensity and concentration.
Then, by measuring the light intensity from an unknown sample, we can accurately determine its lithium concentration. This requires careful control of experimental conditions and sophisticated data processing techniques to minimize errors and ensure accuracy.
Real-World Applications Across Diverse Fields
The ability to both identify and quantify lithium has made emission spectra analysis an indispensable tool in numerous fields. Here are some key examples:
Environmental Monitoring
Lithium is a growing environmental concern due to its increasing use in batteries and its potential impact on water resources. Emission spectroscopy is used to monitor lithium levels in rivers, lakes, and groundwater, ensuring that concentrations remain within safe limits.
This is critical for protecting aquatic ecosystems and human health. Regular monitoring programs employ AES and FES to detect and quantify lithium contamination from industrial discharge or battery recycling processes.
Pharmaceuticals
Lithium carbonate is a widely used medication for treating bipolar disorder. Accurate determination of lithium concentration in pharmaceutical products and patient blood samples is essential for ensuring drug efficacy and preventing toxicity.
Emission spectroscopy provides a rapid and reliable method for quantifying lithium levels, contributing to patient safety and effective treatment outcomes. Pharmaceutical companies use AES and FES to ensure the quality and consistency of their lithium-based medications.
Materials Science
Lithium is a key component in various advanced materials, including ceramics, glasses, and alloys. Precise control of lithium content is crucial for achieving the desired material properties.
Emission spectroscopy is used to analyze the composition of these materials, ensuring that lithium concentrations meet the required specifications. This is critical for optimizing the performance and reliability of these materials in various applications, such as aerospace, electronics, and energy storage.
Battery Production
Lithium-ion batteries are the workhorse of modern portable electronics and electric vehicles. Monitoring lithium levels is critical during the manufacturing process of these batteries.
Emission Spectroscopy ensures optimal performance, longevity, and safety of the final product. Manufacturers rely on AES and FES to analyze the purity of raw materials and the composition of battery components.
Video: Unlock Lithium's Secrets: Emission Spectra Explained!

FAQs: Understanding Lithium's Emission Spectra
Here are some frequently asked questions about lithium's emission spectrum to help clarify the concepts explained.
What exactly is an emission spectrum?
An emission spectrum is the unique pattern of light emitted by a substance when it's excited, such as by heating it. These patterns show distinct bright lines at specific wavelengths. Examining these lines can identify the element, even in complex mixtures. It's like a fingerprint for elements!
Why does lithium have a unique emission spectrum?
Each element has a unique atomic structure, meaning it has different energy levels at which its electrons can exist. When lithium's electrons jump between energy levels and then fall back down, they release photons with very specific energies. These energies correspond to particular wavelengths of light, resulting in the distinctive emission spectra of lithium.
What causes the different colors we see in the emission spectra of lithium?
The different colors, which are specific wavelengths of light, are caused by the varying amounts of energy released when an electron drops from a higher energy level to a lower one in a lithium atom. Each specific energy difference corresponds to a specific wavelength and color. These colors make up the emission spectra of lithium.
How is the emission spectra of lithium used in real-world applications?
Analyzing the emission spectra of lithium allows us to identify it within other materials. It is used in industrial settings and scientific research to determine lithium content, which is important in batteries, pharmaceuticals, and geological surveys. It is also fundamental in understanding stellar composition through spectral analysis.
So, there you have it – a peek behind the curtain of lithium's spectral secrets! Hopefully, you found something useful in this breakdown of the emission spectra of lithium. Now go forth and explore the amazing world of atomic emissions!