False-Colored Micrographs: What Are They REALLY Showing?
False-colored micrographs, a staple in modern cell biology, present visual representations of data derived from techniques like fluorescence microscopy. ImageJ, a widely used image processing software, facilitates the manipulation and analysis of these images. The National Institutes of Health (NIH) funds research that frequently relies on false-colored micrographs for data visualization. Understanding what does it mean if a micrograph is “false-colored?” requires recognizing that the colors represent assigned values or intensities, often correlated with specific cellular components or processes; these colors are not inherent to the original sample but rather artificially applied for enhanced visualization and analysis.
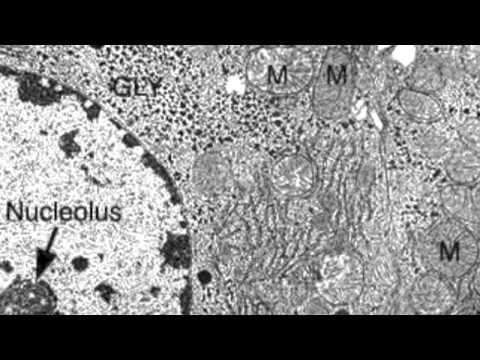
Image taken from the YouTube channel Stephanie Castle , from the video titled 2.3.3 Identify structures from electron micrographs of liver cells .
The scientific literature is awash in vibrant, captivating images. Micrographs, in particular, often showcase an array of colors seemingly unrelated to the samples they depict. These are false-colored micrographs, and their aesthetic appeal contributes significantly to their prevalence in scientific publications, presentations, and even popular science media.
But beyond their undeniable visual allure lies a deeper purpose.
Deciphering the Visual Code
For the uninitiated, these images can be perplexing.
A natural question arises: What information do these images actually convey beyond mere aesthetics? Are these colors simply artistic flourishes, or do they hold quantifiable, scientific meaning?
The answer, unequivocally, is the latter.
The Purpose of This Exploration
This article serves as a comprehensive guide to understanding the world of false color in microscopy. We aim to demystify the techniques and applications behind these striking images.
Our goal is to move beyond the surface-level appreciation of their beauty and delve into the heart of their scientific utility.
Thesis: Illumination Through Color
This article will explain the purpose and interpretation of false color in micrographs.
We will clarify its crucial role in scientific imaging, equipping you with the knowledge to understand the data represented within the color palette.
Furthermore, we will highlight potential pitfalls, emphasizing the importance of critical interpretation and responsible use of this powerful visualization tool.
The Foundation: Understanding Micrographs and the Need for Color
False-colored micrographs serve as a powerful tool for visualizing the microscopic world, but to fully appreciate their significance, a foundational understanding of microscopy and the inherent limitations of certain techniques is essential. This section provides the necessary background to contextualize the use of false color and its role in scientific discovery.
Microscopy: A Window into the Infinitesimal
Microscopy, at its core, is the science of visualizing objects and structures too small to be seen with the naked eye.
It is an indispensable tool across diverse scientific disciplines, from biology and medicine to materials science and engineering.
Microscopes utilize lenses, and sometimes electron beams, to magnify and resolve fine details, revealing the intricate architecture of cells, tissues, and materials.
Its contributions to advancements in research are immeasurable, allowing for the visualization of everything from cellular organelles to nanoscale structures.
The Challenge of Color in Microscopy
While some microscopy techniques, like light microscopy, can capture inherent color information from a sample, others are fundamentally limited in this regard.
Electron microscopy (EM), for example, relies on beams of electrons rather than light to image a specimen.
Electrons, unlike photons of light, do not possess color. EM images are, therefore, inherently grayscale, representing variations in electron density within the sample.
Similarly, other techniques might produce data as numerical values representing different signals, not as colors.
Micrographs: Visualizing Microscopic Data
A micrograph is simply a visual representation of the data acquired through microscopy.
It's the tangible outcome of the microscopic process, whether it's a digitally captured image from a light microscope or a processed rendering from an electron microscope.
Micrographs transform the invisible into something we can see, analyze, and interpret. They bridge the gap between raw data and scientific understanding.
Enhancing Contrast and Unveiling the Invisible
Often, the inherent contrast in a raw micrograph is insufficient to clearly distinguish important features.
Image processing techniques become necessary to amplify subtle differences and highlight key structures.
These techniques can involve adjusting brightness and contrast, applying filters to reduce noise, and, crucially, introducing false color.
Without such enhancement, critical details might remain hidden, hindering accurate analysis and interpretation.
False Color: A Data Visualization Tool
False color emerges as a crucial tool in situations where inherent color information is absent or insufficient. It allows researchers to assign colors to different intensity values or structural components within a micrograph.
This is not arbitrary. The assigned colors are directly related to quantifiable data, such as signal strength or density.
By mapping data to color, false color transforms grayscale images into visually rich representations that reveal subtle variations and patterns that would otherwise be imperceptible. It turns the invisible into the interpretable.
Decoding the Science: How False Color Works
Having established the fundamental necessity of false color in microscopy and its pivotal role in data visualization, we can now unpack the inner workings of this transformative process.
How exactly are these grayscale or numerically-represented datasets translated into the vibrant, information-rich images we see?
The False Color Mapping Process
The application of false color is, at its heart, a process of data remapping.
Microscopy techniques often produce images where each pixel represents a certain value. This could be related to signal strength, electron density, or even height.
These values, inherently devoid of color information, are then assigned a color based on a pre-defined lookup table (LUT), or color palette.
In its simplest form, a LUT might map low values to blue, intermediate values to green, and high values to red. However, the possibilities are virtually limitless.
More complex LUTs can incorporate hundreds or even thousands of colors.
The choice of palette is not arbitrary, but should be carefully considered to best highlight the specific features of interest.
Intensity Values and Color Palettes
Imagine a grayscale electron micrograph of a cell. Darker areas indicate regions of higher electron density, while lighter areas indicate lower density.
To apply false color, each grayscale value is assigned a corresponding color from the chosen palette.
For example, the darkest regions (highest electron density) might be mapped to a deep blue, while the lightest regions (lowest electron density) are mapped to a bright yellow.
The intermediate grayscale values are then assigned colors that smoothly transition between these extremes.
This creates a false-colored image where different electron densities are represented by different colors.
Signal strength in fluorescence microscopy can also be mapped to various colors.
Examples Across Microscopy Techniques
Fluorescence Microscopy
In fluorescence microscopy, specific molecules within a sample are labeled with fluorescent dyes.
When illuminated with a specific wavelength of light, these dyes emit light at a different wavelength, which can be detected and recorded.
The intensity of the emitted light corresponds to the amount of the labeled molecule present.
False color can be used to represent the distribution and concentration of these molecules within the sample.
For example, one protein might be labeled with a dye that emits green light, while another protein is labeled with a dye that emits red light.
The resulting image would show the distribution of each protein in its corresponding color.
Electron Microscopy
As previously mentioned, electron microscopy inherently produces grayscale images.
False color is often applied to enhance contrast and to reveal subtle differences in electron density.
For instance, a researcher studying the structure of a virus might use false color to highlight the different protein components of the viral capsid.
One protein could be colored blue, another yellow, and another green, allowing for easy visualization of their arrangement.
Atomic Force Microscopy
Atomic Force Microscopy (AFM) doesn't directly produce color data. It generates a height map of a surface at the nanoscale.
False color is applied to these height maps, assigning colors to different height values to create visually informative images.
Enhancing Visualization of Subtle Differences
One of the key benefits of false color is its ability to amplify subtle differences that might be difficult to discern in a grayscale image.
The human eye is more sensitive to color variations than to subtle changes in grayscale intensity.
By mapping small changes in intensity to different colors, false color can reveal structural and compositional differences that would otherwise be invisible.
This is particularly useful for identifying boundaries between different regions, visualizing gradients in concentration, and detecting subtle variations in morphology.
Applications in Cell Biology
In cell biology, false color is used extensively to visualize the intricate architecture of cells and their components.
It can be used to highlight the distribution of different proteins, to visualize the organization of organelles, and to study the dynamics of cellular processes.
For example, researchers might use false color to visualize the localization of specific proteins within the cell nucleus, to study the assembly of microtubules during cell division, or to track the movement of vesicles within the cytoplasm.
These applications are crucial for understanding cellular function and for developing new therapies for diseases.
Having explored the theoretical underpinnings and potential pitfalls of false color imaging, it's time to ground our understanding in practical examples. By examining specific case studies, we can appreciate the true power and versatility of this technique across diverse scientific fields.
Real-World Applications: Case Studies in False Color Imaging
False color imaging is not merely an aesthetic enhancement; it is a powerful analytical tool that unlocks hidden information within microscopic data. Let's delve into several case studies to illustrate its practical applications and transformative impact.
Case Study 1: Diagnosing Diseases in Histology
Histology, the study of tissues, relies heavily on microscopic examination of stained samples. While traditional staining techniques provide contrast, false color imaging can further enhance the visualization of subtle pathological changes that might otherwise be missed.
Identifying Pathological Conditions
In diagnostic pathology, false color can be used to highlight specific biomarkers or structural abnormalities indicative of disease. For example, in liver biopsies, different colors can be assigned to collagen fibers, inflammatory cells, and hepatocytes, allowing pathologists to quickly assess the extent of fibrosis or inflammation.
By selectively coloring these features, subtle differences in tissue composition, indicative of early-stage disease, become readily apparent. This enhanced visualization aids in accurate diagnosis and treatment planning.
Benefits of False Color in Histology
The use of false color in histology offers several advantages:
- Improved contrast and visualization of subtle pathological changes.
- Facilitated identification and quantification of specific tissue components.
- Enhanced diagnostic accuracy and reduced inter-observer variability.
Ultimately, false color imaging empowers pathologists to make more informed decisions, leading to better patient outcomes.
Case Study 2: Visualizing Protein Localization Within Cells
Fluorescence microscopy is a cornerstone of cell biology, allowing researchers to visualize the distribution of specific proteins within cells. False color plays a crucial role in differentiating and highlighting multiple protein targets simultaneously.
Multi-Labeling and Co-Localization Studies
In multi-labeling experiments, different fluorescent dyes are used to tag distinct proteins. False color assignment is then used to represent each protein with a unique color, allowing researchers to visualize their relative locations and interactions.
This is particularly useful for studying protein co-localization, where the proximity of two or more proteins suggests a functional relationship. For example, researchers might use false color to show that two proteins involved in DNA replication are localized to the same region of the nucleus, indicating that they interact during the replication process.
Applications in Cell Biology Research
False color visualization of protein localization has broad applications in cell biology research:
- Mapping protein distributions within organelles and cellular compartments.
- Studying protein-protein interactions and signaling pathways.
- Investigating the effects of drugs or genetic mutations on protein localization.
By revealing the intricate spatial organization of proteins within cells, false color imaging provides valuable insights into cellular function and disease mechanisms.
Case Study 3: Studying Material Structure Using Electron Microscopy
Electron microscopy (EM) provides high-resolution images of materials at the nanoscale. However, EM images are inherently grayscale, lacking color information. False color is often used to enhance the visualization of subtle variations in composition and morphology.
Revealing Nanoscale Features
In materials science, false color can be applied to EM images to reveal nanoscale features that are not readily apparent in grayscale. For example, in the study of composite materials, different colors can be assigned to the different phases, allowing researchers to visualize the distribution and orientation of these phases.
Enhancing Material Characterization
False color imaging enhances material characterization in several ways:
- Visualizing the grain structure of metals and ceramics.
- Identifying defects and impurities in semiconductors.
- Analyzing the morphology of nanoparticles and thin films.
By providing a more visually informative representation of material structure, false color imaging aids in the development of new materials with improved properties.
Video: False-Colored Micrographs: What Are They REALLY Showing?

FAQs: Understanding False-Colored Micrographs
Hopefully this clears up some confusion about false-colored micrographs! Let's dive into some common questions.
What is a false-colored micrograph?
A false-colored micrograph is an image where colors have been artificially added to represent different features or intensities. Because electron microscopes produce grayscale images and sometimes other imaging techniques don't capture images in the visible light spectrum, scientists apply colors. If a micrograph is "false-colored," it means the colors aren't the actual colors of the sample, but rather assigned for visual clarity and analysis.
Why are false colors used in microscopy?
False coloring enhances contrast and highlights specific details that might be difficult to see in grayscale images. It allows researchers to distinguish between different structures or components within a sample more easily. Also, by assigning different colors to different signals or intensities, scientists can more easily communicate their findings.
Are the colors in a false-colored micrograph arbitrary?
While the specific colors used can be somewhat subjective, they are usually chosen to be easily distinguishable and meaningful within the context of the study. The caption or accompanying text should always explain what each color represents. So, what does it mean if a micrograph is "false-colored?" That there is a key provided to decode the color representation!
Can I trust the information presented in a false-colored micrograph?
Yes, absolutely! False coloring is a standard scientific technique, but it's important to understand that the colors are representations, not the actual colors of the sample. As long as the image is properly labeled and the color scheme is explained, the underlying data and information are accurate and reliable.