Desmos Piecewise Graphs: The EASIEST Guide Online!
Desmos, a free online graphing calculator, provides users accessible tools. Piecewise functions present unique challenges for visualization. Teachers often use Desmos to illustrate mathematical concepts effectively. This guide shows how to graph piecewise on desmos, simplifying the process so you can learn the skill quickly. Students will also find Desmos a helpful tool when studying math.
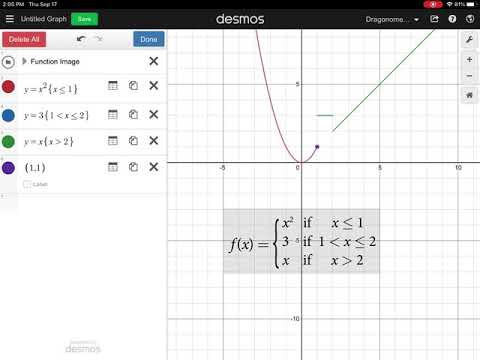
Image taken from the YouTube channel Dragonometry , from the video titled Graphing Piecewise Functions with Desmos .
Piecewise functions, with their unique definitions across different intervals, can seem daunting to visualize and understand. Fortunately, Desmos, a user-friendly graphing calculator, offers an intuitive way to bring these functions to life. This section will explore the core concept of piecewise functions, introduce Desmos as a valuable tool, and highlight its advantages for graphing these functions compared to traditional methods.
Understanding Piecewise Functions
Piecewise functions are functions defined by multiple sub-functions, each applicable over a specific interval of the main function's domain. Instead of a single equation governing the entire function, piecewise functions use different equations for different segments of the x-axis.
These segments are called pieces, and each piece has its own defining equation and a specific domain restriction.
The purpose of piecewise functions is to model situations where a relationship changes depending on the input value.
For example, a cell phone billing plan might have a fixed monthly cost for a certain number of gigabytes, and then an additional charge for each gigabyte exceeding that limit. This creates a piecewise function where the cost behaves differently depending on data usage.
Desmos: Your Graphing Ally
Desmos is a free, online graphing calculator renowned for its ease of use and powerful capabilities. Its intuitive interface allows users to quickly input equations and visualize their corresponding graphs.
Desmos stands out as an exceptional tool for students, educators, and professionals seeking to explore mathematical concepts visually. Its accessibility, combined with its interactive features, makes it an ideal platform for learning and experimentation.
Whether you're a beginner or an experienced mathematician, Desmos offers a seamless experience for graphing and analyzing functions.
Why Desmos for Piecewise Functions?
Graphing piecewise functions can be challenging using traditional methods. Manually calculating points for each piece and plotting them accurately is time-consuming and prone to errors.
Desmos simplifies this process significantly. Its syntax allows you to define the function and its domain restrictions in a single, clear expression. The calculator then automatically generates the correct graph.
Compared to other graphing calculators or software, Desmos offers a more user-friendly interface and a streamlined workflow specifically beneficial for visualizing piecewise functions. This makes it easier to focus on understanding the function's behavior rather than struggling with complicated syntax or manual calculations.
Piecewise functions, with their unique definitions across different intervals, can seem daunting to visualize and understand. Fortunately, Desmos, a user-friendly graphing calculator, offers an intuitive way to bring these functions to life. This section will explore the core concept of piecewise functions, introduce Desmos as a valuable tool, and highlight its advantages for graphing these functions compared to traditional methods.
Now that we’ve established the role of Desmos in simplifying the visualization of piecewise functions, it’s crucial to solidify our understanding of what these functions are at their core. Before diving into the practicalities of graphing, let’s establish a robust conceptual foundation, clarifying the formal definition, essential terminology, and the critical roles of domains and restrictions.
Understanding Piecewise Functions: A Conceptual Foundation
Piecewise functions might seem complex initially, but breaking down their definition and components makes them much more approachable. Let's delve into the formal definition, notation, and the underlying concepts that govern these functions.
Defining Piecewise Functions Formally
A piecewise function is formally defined as a function that is defined by multiple sub-functions, each applying to a specific interval of the main function's domain. Think of it as a collection of different functions stitched together, each active only within its designated zone.
The notation often involves a large brace, with each row specifying a sub-function and its corresponding domain.
For example:
f(x) = { x^2, for x < 0 { 2x + 1, for 0 ≤ x < 2 { 3, for x ≥ 2
This notation clearly indicates which function applies to which x-values. Understanding this notation is key to interpreting and working with piecewise functions.
The Critical Role of Domains
The domain of a function is the set of all possible input values (x-values) for which the function is defined. In piecewise functions, the domain is divided into distinct intervals, each associated with a specific sub-function.
Each “piece” of a piecewise function has its own domain. This domain restriction dictates where that particular piece is "active" or contributes to the overall function's output.
Without clearly defined domains, the function would be ambiguous, and we wouldn’t know which rule to apply for a given input. The domain restrictions are what make each piece distinct and define the function's behavior across its entire range.
Restrictions: Defining the Individual Pieces
Restrictions on a function's domain are conditions that limit the input values for which a particular piece of the function is defined. These restrictions act as boundaries, dictating where one piece ends and another begins.
These restrictions are typically expressed as inequalities, defining the interval over which the corresponding sub-function is valid. For instance, "x < 0" is a restriction that limits the first piece of our example function to all x-values less than zero.
Inequalities and Interval Notation
Inequalities are the mathematical tools we use to define these domain restrictions. They specify the range of x-values for which a particular piece of the function is applicable.
Common inequality symbols include:
- < (less than)
-
(greater than)
- ≤ (less than or equal to)
- ≥ (greater than or equal to)
These inequalities can also be expressed using interval notation, which provides a concise way to represent a range of values. For example, x < 0 can be written as (-∞, 0), and 0 ≤ x < 2 can be written as [0, 2).
Understanding how to translate between inequalities and interval notation is crucial for accurately defining and interpreting the domains of piecewise functions. The correct use of parentheses and brackets is also vital, as parentheses indicate exclusion of the endpoint, while brackets indicate inclusion.
Piecewise functions can be abstract, and visualization is key to grasping their behavior. Desmos offers a streamlined approach to graph these functions. This section will provide a step-by-step guide to using Desmos effectively, breaking down the input process and showcasing practical techniques for clarity and precision.
Step-by-Step Guide: Graphing Piecewise Functions on Desmos
This section serves as a practical guide, walking you through the process of inputting and visualizing piecewise functions within Desmos. We will cover everything from accessing the platform to mastering the syntax necessary for defining these functions accurately.
Accessing the Desmos Graphing Calculator
Desmos is readily accessible through two primary channels:
-
Web Browser: Simply navigate to Desmos.com using any modern web browser. The interface is intuitive and requires no downloads or installations.
-
Mobile App: Desmos offers free mobile apps for both iOS and Android devices. These apps provide the same functionality as the web version, optimized for touch screen use.
Entering a Piecewise Function
The heart of graphing on Desmos lies within its equation editor. Here's how to use it effectively for piecewise functions:
Understanding the Equation Editor
Desmos's equation editor is designed for user-friendliness. To input a function, simply click on an empty input field (labeled "1," "2," etc.) on the left-hand side of the screen.
This will activate the editor, allowing you to type your function definitions.
Desmos Syntax for Piecewise Functions
Desmos uses a specific syntax to interpret piecewise functions. The key components are:
-
Function Rule: This is the mathematical expression defining the function (e.g.,
x^2,2x + 1). -
Domain Restriction: This specifies the interval over which the function rule applies. It's enclosed in curly braces
{}. -
Inequalities: Inequalities define the domain. For example,
x < 0,0 <= x < 2,x >= 2.
Defining the Function Rule and Domain
The general format is: y = functionrule{domainrestriction}. Let's break down a concrete example: y = x{0<x<3}
-
y = x: This is the function rule. In this case, it’s a simple linear function. -
{0<x<3}: This is the domain restriction. It specifies that the functiony = xis only defined for values ofxbetween 0 and 3 (exclusive).
Desmos interprets this as "graph the line y = x only where x is greater than 0 and less than 3."
Graphing Multiple Pieces
Piecewise functions, by definition, consist of multiple 'pieces,' each with its own rule and domain. Here's how to graph them effectively on Desmos:
Adding Additional Pieces
For each additional 'piece' of your piecewise function, simply add a new line in the Desmos equation editor. Each line will represent a separate function rule and its corresponding domain restriction.
Ensuring Clarity with Non-Overlapping Restrictions
It is critical to ensure that the domain restrictions for each piece are correctly defined and do not overlap. Overlapping domains will lead to Desmos plotting multiple values for a single x-value, resulting in an incorrect graph.
Non-overlapping restrictions ensure that each x-value corresponds to only one function rule, accurately representing the piecewise function. Take extra care when defining these restrictions, using inequalities precisely to avoid ambiguities.
Advanced Techniques and Desmos Customization
Having mastered the basics of graphing piecewise functions on Desmos, you can now explore more sophisticated methods to enhance the clarity and impact of your visualizations. These techniques involve using inequalities effectively, customizing the appearance of your graphs, and troubleshooting common errors. This allows for greater precision and a deeper understanding of the functions.
Mastering Inequalities for Domain Definition
Precise domain definition is crucial for accurate piecewise function representation. Desmos allows for the effective use of inequalities, including compound inequalities, to achieve this precision.
Single Inequalities
Single inequalities, like x > 2 or x ≤ -1, define domains bounded on one side. These are the building blocks for more complex domain restrictions.
Compound Inequalities
Compound inequalities combine two or more inequalities to define a domain bounded on both ends. For instance, 0 < x < 5 restricts the function to values between 0 and 5, excluding 0 and 5 themselves. Desmos interprets these compound inequalities directly within the function definition.
To input this effectively, you would enter y = f(x){0 < x < 5}, where f(x) is the function rule. Note: You can also use "≤" and "≥" for inclusive boundaries.
Combining Multiple Inequalities
For piecewise functions with disjointed domains, you can use multiple inequalities separated by commas. For example, to define a function valid for x < -2 and x > 2, the syntax would be y = f(x){x < -2, x > 2}. Desmos interprets the comma as a logical "or," including all values satisfying either inequality.
Customizing Graph Appearance
Desmos provides extensive customization options to enhance the visual appeal and clarity of your graphs. Tailoring the appearance helps to highlight key features and improve understanding.
Changing Colors and Line Thickness
To modify the color of a function's graph, click the gear icon next to the equation in the input field. This opens a settings menu where you can select a new color from the palette.
You can also adjust the line thickness using the same settings menu. Thicker lines can help emphasize specific parts of the graph.
Adjusting Axis Labels and Range
Clear axis labels are essential for conveying the meaning of the graph. Double-click on the axis labels to edit them directly. You can label the x-axis as "Time (s)" and the y-axis as "Distance (m)", for instance.
To change the visible range of the axes, click the graph settings icon (wrench) in the top right corner. Here, you can manually set the minimum and maximum values for both the x and y axes. Adjusting the range allows you to focus on the most relevant parts of the function's behavior.
Troubleshooting Common Issues
Graphing piecewise functions on Desmos can sometimes present challenges. Recognizing and addressing common issues is crucial for a smooth workflow.
Syntax Errors
Syntax errors are the most frequent problems. Ensure you are using the correct Desmos syntax for piecewise functions, including proper use of brackets and inequalities. Double-check for typos and missing symbols. Desmos usually highlights syntax errors in red, making them easier to identify.
Incorrect Domain Definitions
Incorrectly defined domains can lead to unexpected graph behavior. Carefully review your inequalities to ensure they accurately represent the desired domain restrictions. Pay close attention to inclusive versus exclusive boundaries (using < vs. ≤).
Overlapping Domains
Overlapping domains can result in ambiguity. Piecewise functions should have non-overlapping domains to ensure a unique output for each input value. Double-check your domain definitions to avoid any overlap. If overlap is unavoidable, Desmos will typically prioritize the first defined function rule in the overlapping region.
Practice Problems: Putting Your Knowledge to the Test
Having explored the intricacies of graphing piecewise functions and mastering Desmos' customization features, it's time to solidify your understanding through practical application. The following examples and practice problems are designed to test your ability to define, input, and visualize piecewise functions effectively.
Worked Examples: Diverse Piecewise Functions on Desmos
Let's delve into several examples of piecewise functions, demonstrating how to represent various domain restrictions and function definitions on Desmos. These examples will illustrate different scenarios you might encounter.
Example 1: A Simple Two-Piece Function
Consider the following piecewise function:
f(x) =
- x + 2, for x < 0
- -x + 2, for x ≥ 0
To graph this on Desmos, you would input:
y = x + 2 {x < 0}
y = -x + 2 {x ≥ 0}
This creates a V-shaped graph.
The first line defines the function for all x values less than 0, while the second line defines it for all x values greater than or equal to 0.
Example 2: A Function with a Constant Piece
Here's a piecewise function with a constant value over a specific domain:
g(x) =
- x², for x ≤ 1
- 1, for 1 < x < 3
- 4 - x, for x ≥ 3
On Desmos, this translates to:
y = x^2 {x ≤ 1}
y = 1 {1 < x < 3}
y = 4 - x {x ≥ 3}
Notice how the constant piece is defined within a bounded interval.
Example 3: Disjointed Domains
This example demonstrates a piecewise function with disjointed domains:
h(x) =
- -x, for x < -2
- x, for x > 2
In Desmos, this is represented as:
y = -x {x < -2}
y = x {x > 2}
This creates two separate lines that do not intersect, highlighting the disjointed nature of the domains.
Practice Problems for Self-Assessment
Now, it's your turn to apply what you've learned. Try graphing the following piecewise functions on Desmos. Solutions are provided below for self-assessment.
-
Graph the piecewise function:
f(x) =
- 2x + 1, for x < -1
- 3, for -1 ≤ x ≤ 2
- -x + 5, for x > 2
-
Graph the piecewise function:
g(x) =
- x³, for x < 0
- √x, for x ≥ 0
-
Graph the piecewise function:
h(x) =
- 4, for x ≤ -3
- x + 7, for -3 < x < 0
- -2x + 7, for x ≥ 0
Solutions to Practice Problems
-
f(x) Solution:
y = 2x + 1 {x < -1}y = 3 {-1 ≤ x ≤ 2}y = -x + 5 {x > 2} -
g(x) Solution:
y = x^3 {x < 0}y = sqrt(x) {x ≥ 0} -
h(x) Solution:
y = 4 {x ≤ -3}y = x + 7 {-3 < x < 0}y = -2x + 7 {x ≥ 0}
By working through these examples and practice problems, you can reinforce your understanding of graphing piecewise functions on Desmos and build confidence in your ability to tackle more complex problems. Remember to pay close attention to domain restrictions and syntax to ensure accurate representations.
Video: Desmos Piecewise Graphs: The EASIEST Guide Online!

Desmos Piecewise Graphs: Frequently Asked Questions
Here are some common questions about creating and understanding piecewise functions using Desmos.
What exactly is a piecewise function?
A piecewise function is defined by multiple sub-functions, each applying to a specific interval of the domain. Imagine a function that behaves differently depending on the x-value you input. Desmos makes visualizing these simple!
How do you actually graph piecewise functions on Desmos?
The key is using inequalities within curly braces { }. For example, y = {x < 0: x^2, x >= 0: x} graphs x² when x is less than 0, and x when x is greater than or equal to 0. Desmos interprets those braces and conditions as the "pieces" of how to graph piecewise on desmos.
I'm getting weird gaps in my Desmos graph. Why is that?
Gaps often happen when the endpoints of your intervals don't line up perfectly. Carefully check your inequalities (using <, >, ≤, ≥) to ensure there's no overlap or missing space. How to graph piecewise on desmos often involves very precise inequalities.
Can I use more than two "pieces" in a Desmos piecewise function?
Absolutely! Just keep adding more conditions within the curly braces, separated by commas. For example, y = {x < -1: -x, -1 <= x <= 1: x^2, x > 1: x} would define three separate parts of the function and demonstrates how to graph piecewise on desmos with multiple pieces.